Live P&L panel
Realized and unrealized profit and loss updated on every tick, with intraday and rolling 30-day views — so you always know where the session stands.
Monitoring Dashboard
Our custom monitoring dashboards deliver live P&L, position status, system health alerts, and execution logs in a clean azure-toned interface.
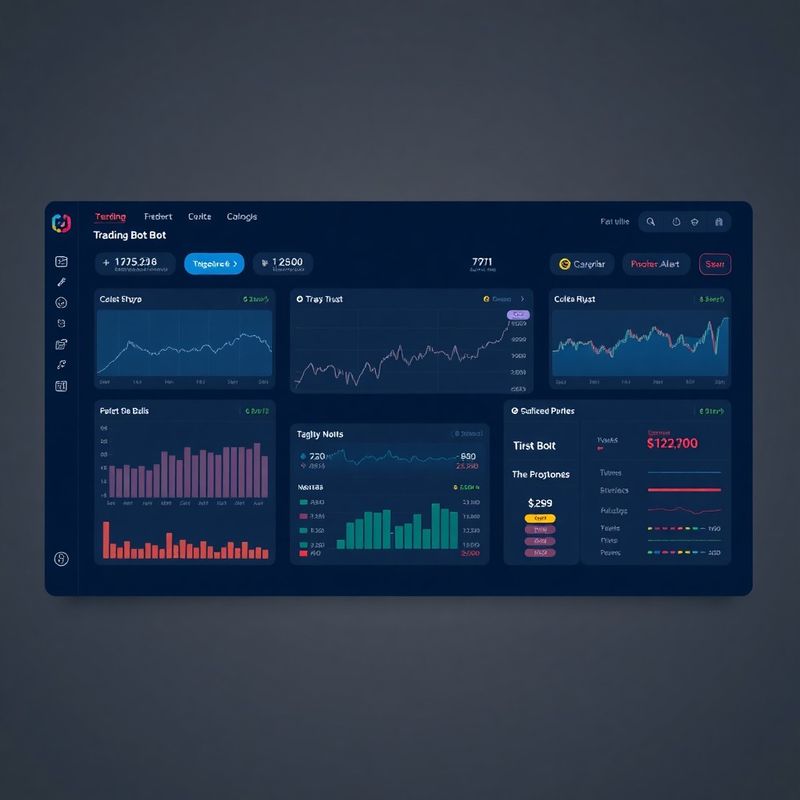
A bot running without a monitoring layer is a process you've trusted but cannot verify. Our dashboards are built in Grafana or a lightweight React frontend (depending on your preference and infrastructure) and connect directly to your bot's logging system. They display live unrealized P&L, closed trade history, current open positions with entry prices and elapsed time, system uptime metrics, and a color-coded alert panel for risk-control events. Alerts fire via email and Telegram when a drawdown threshold is approached, a broker connection drops, or an unexpected error halts execution. The azure-trust color language of the interface — cool blues against a neutral dark background — is chosen deliberately: it reduces visual fatigue during extended monitoring sessions and highlights critical alerts in high-contrast amber without creating alarm where none is warranted. The dashboard requires no local software; it runs in any browser.
Realized and unrealized profit and loss updated on every tick, with intraday and rolling 30-day views — so you always know where the session stands.
Instant notifications when a risk threshold is hit, a broker connection interrupts, or the bot's execution process stops for any reason.
Every order attempt, fill, rejection, and risk-gate block is logged with a millisecond timestamp — auditable and exportable for your own records.
System health indicators for VPS CPU load, broker API latency, and bot process status — visible at a glance so you catch infrastructure issues before they affect trading.
We'll walk you through a live demo of a running bot's monitoring setup.
Request a demo